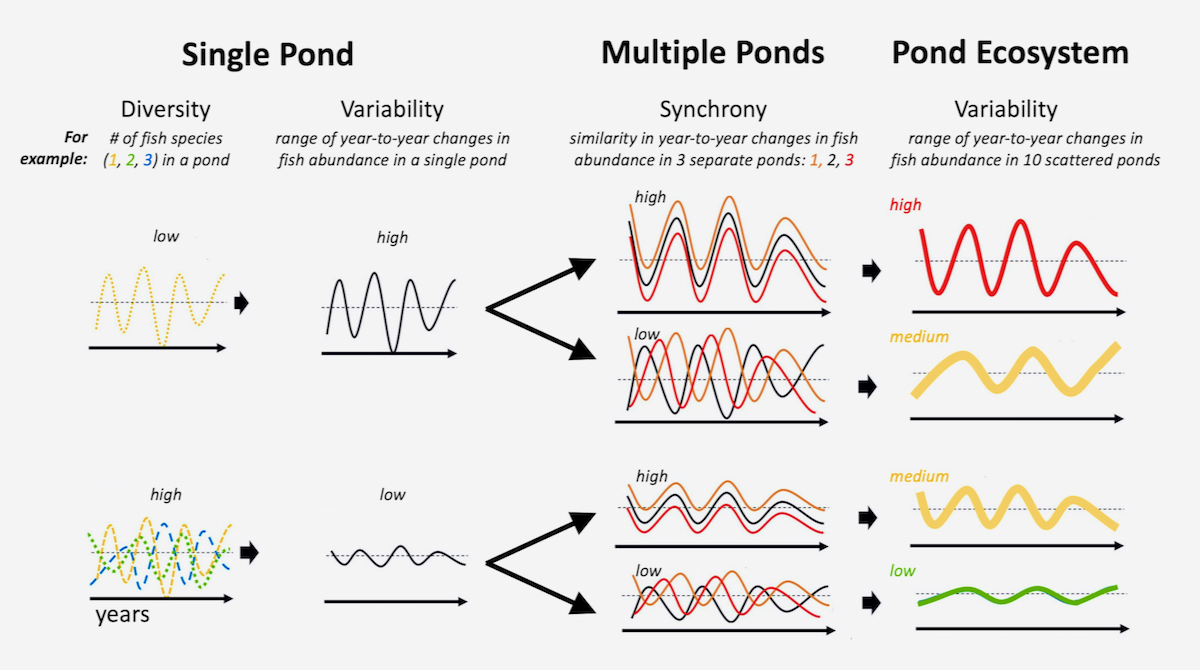
Figure 1. Conceptual diagram using fish in ponds to illustrate how variability propagates from small to large scales. Labels show year-to-year changes in the abundance of three hypothetical fish species and in the total abundance among all species at each of three different ponds. The diagram shows that stable, healthy ecosystems—ones with little change though time as shown in green in the lower right-hand corner—result from high diversity in the number of species at the local scale (a single pond), together with little overlap among population changes in different ponds, which smooths out overall fluctuations in species populations at the regional scale.