

VIMS modeler joins in ensemble forecast of Gulf dead zone
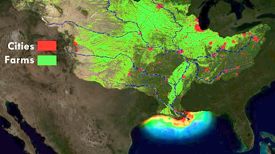
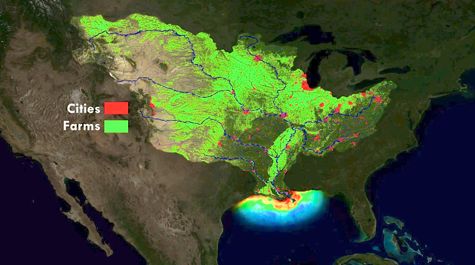 Dead Zone Dynamics One of the largest dead zones forms in the Gulf of Mexico each spring as farmers fertilize their lands preparing for crop season. Rain washes excess nitrogen from fertilizers off the land and into streams and rivers, which carry it to the coastal ocean where it fuels low-oxygen dead zones that can displace or suffocate marine life. Credit: NOAA
NOAA-funded program helps refine nutrient-reduction goals
Fueled by human activities that release excess nutrients into rivers, streams, and groundwater, low-oxygen “dead zones” are a growing threat to marine life in coastal areas worldwide.
Now, Assistant Research Scientist David Forrest of the Virginia Institute of Marine Science has added his contribution to a 6-model “ensemble forecast” that the National Oceanic and Atmospheric Administration uses to predict the size of the dead zone that forms off the Mississippi Delta each summer.
The NOAA-supported models predict this year's Gulf of Mexico dead zone to be “average,” encompassing an area ranging from 4,633 to 5,708 square miles (12,000 to 14,785 square kilometers). That’s about the size of the state of Connecticut. Forrest’s prediction of 12,000 km2 provides the small end of the forecast range, and itself incorporates a range of between 5,800 and 18,300 km2, with 90% confidence that actual values will fall between those bounds.
While this year’s Gulf dead zone is forecast to be close to the average size observed since the 1990s, this is many times larger than what research indicated before human influences greatly expanded its extent and impacts. The dead zone affects nationally important commercial and recreational fisheries and threatens the region's economy.
Ensemble forecasting
Like the ensemble forecasts that NOAA uses to predict the probable track of a tropical storm, the suite of dead-zone forecasts provide a likely range for the size of the Gulf’s summertime dead zone, and allow the modelers to refine their forecasts through time by comparing which perform well or poorly under differing nitrogen loads, weather patterns, and biological conditions.
NOAA and other federal and stage agencies use the forecasts to determine the nutrient reductions needed to shrink the dead zone’s size and to test the effectiveness of different management actions in the vast Mississippi River watershed.
 The dead zone’s actual size will be measured in mid-July during a monitoring survey led by the Louisiana Universities Marine Consortium, which has been performing this service on an annual basis since 1985. The monitoring team will release its results in late July or early August.
VIMS forecast model
Forrest’s prediction—based on a statistical correlation between the size of the Gulf dead zone and the average measured load of nitrogen in Mississippi River discharge during May—takes its place among similar forecasts developed by NOAA-sponsored modelers at the University of Michigan, Louisiana State University, the Louisiana Universities Marine Consortium, Texas A&M University, and the U.S. Geological Survey (USGS).
All the models rely on nutrient-loading estimates from the USGS. The models also account for the influence of variable weather and oceanographic conditions, and predict that these can affect the dead-zone area by as much as 38 percent.
Forrest’s model is based on the findings of a research paper published in Environmental Research Letters in 2011 with Robert Hetland and Steven DiMarco of Texas A&M University. In addition to river discharge and nitrogen concentration as measured in the Mississippi in May, their research showed the size of the Gulf dead zone also correlates with wind speed and direction along the Louisiana-Texas shoreline in mid-June to mid-July, and the region’s growing sensitivity to nutrient inputs since 1993.
Forrest plans to produce a revised forecast later this summer, when wind data from the dead-zone area become available.
“We don’t have the wind data yet,” says Forrest, “so for the current forecast we used a model with only the predictor variables available at this point in time. Once the measurements are taken and confirmed, there are more data available to help identify forcing mechanisms as in our paper.”