

VIMS modeler joins in ensemble forecast of 2016 Gulf dead zone
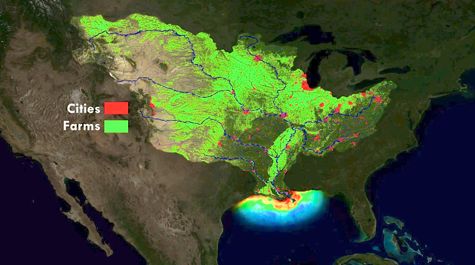 Dead Zone Dynamics One of the largest dead zones forms in the Gulf of Mexico each spring as farmers fertilize their lands preparing for crop season. Rain washes excess nitrogen from fertilizers off the land and into streams and rivers, which carry it to the coastal ocean where it fuels low-oxygen dead zones that can displace or suffocate marine life. Credit: NOAA
For the third year running, Dr. David Forrest of William & Mary’s Virginia Institute of Marine Science has added his contribution to the multi-model “ensemble forecast” that the National Oceanic and Atmospheric Administration uses to predict the size of the low-oxygen “dead zone” that forms off the Mississippi Delta each summer.
Fueled by human activities that release excess nutrients into rivers, streams, and groundwater, dead zones are a growing threat to marine life in coastal areas worldwide, including Chesapeake Bay. The dead zone in the Gulf of Mexico affects nationally important commercial and recreational fisheries.
The NOAA-supported models forecast that this year’s Gulf of Mexico dead zone will be approximately 5,898 square miles or about the size of Connecticut—the same range as it has averaged over the last several years.
"Dead zones are a real threat to Gulf fisheries and the communities that rely on them,” says Dr. Russell Callender, assistant NOAA administrator for the National Ocean Service. “We’ll continue to work with our partners to advance the science to reduce that threat. One way we’re doing that is by using new tools and resources, like better predictive models, to provide better information to communities and businesses."
The NOAA-sponsored Gulf of Mexico hypoxia forecast is improving due to advancements of individual models and an increase in the number of models used for the forecast. Forecasts based on multiple models are called ensemble forecasts and are commonly used in hurricane and other weather forecasts.
This year marks the second year that NOAA has used an ensemble forecast with four models. Predictions from the four individual models range from 5,204 to 6,823 square miles, and have a collective predictive interval of 3,200 to 8,597 square miles. The forecast assumes typical weather conditions, and the actual dead zone could be disrupted by hurricanes or tropical storms. Data from these four models are used to determine and meet the nutrient-reduction targets set by the interagency Mississippi River/Gulf of Mexico Watershed Nutrient Task Force
VIMS prediction
Forrest's prediction—based on a statistical correlation between the size of the Gulf dead zone and the average measured discharge and nitrogen concentration in the Mississippi River during May—provides the small end of the forecast range at 5,204 square miles (13,500 km2). His forecast itself incorporates a range of between 2,342 and 8,079 square miles, with 90% confidence that actual values will fall within those bounds.
Forrest says his prediction is “several hundred square miles smaller than the others, due to my inclusion of some years with tropical storms that some of the other modelers exclude.” High waves from these storms can reduce dead-zone conditions by mixing surface oxygen into deeper waters.
Forrest's prediction for last year—which forecast a dead zone of 4,344 square miles with a range of between 2,000 and 6,750 square miles—fell short of the actual dead-zone area, which was measured in late July of 2015 at 6,471 square miles. He attributes the difference to weather and oceanographic conditions that were more favorable for hypoxia than the long-term average. "Atmospheric and oceanographic weather can dramatically affect hypoxic area, serving to mix more or less oxygen into bottom waters," says Forrest. "My forecast doesn't include weather conditions since it is so far in advance of the survey cruise." Last year's ensemble forecast, at 5,483 square miles, was also slightly below the observed dead-zone area.
The other models in the ensemble forecast are developed by NOAA-sponsored modeling teams and researchers at the University of Michigan, Louisiana State University, Louisiana Universities Marine Consortium, Texas A&M University, North Carolina State University, and the United States Geological Survey. The NOAA hypoxia forecast is part of a larger NOAA effort to deliver ecological forecasts that support human health and well-being, coastal economies, and coastal and marine stewardship.
USGS steamflow and nutrient data
Data on nutrient runoff and river flow for the Gulf of Mexico hypoxia forecast is provided by the United States Geological Survey. USGS estimates that 146,000 metric tons of nitrate and 20,800 metric tons of phosphorus flowed down the Mississippi and Atchafalaya rivers into the Gulf of Mexico in May 2016. This is about 12% above the long-term (1980-2015) average for nitrogen, and 25% above the long-term average for phosphorus.
USGS operates more than 2,700 real-time stream gauges, 60 real-time nitrate sensors, and collects water quality data at long-term stations throughout the Mississippi River basin to track how nutrient loads are changing over time.
“By expanding the real-time nitrate monitoring network with partners throughout the basin, USGS is improving our understanding of where, when, and how much nitrate is pulsing out of small streams and large rivers and ultimately emptying to the Gulf of Mexico,” says Dr. Sarah J. Ryker, acting deputy assistant secretary for water and science at the Department of the Interior. “The forecast puts these data to additional use by showing how nutrient loading fuels the hypoxic zone size.”
The confirmed size of the 2016 Gulf dead zone will be released in early August, following a monitoring survey from July 24 to August 1, conducted on a NOAA vessel and funded through a partnership between NOAA, Northern Gulf Institute, and the Louisiana Universities Marine Consortium.