

Environmental Conditions
Climate data can tell an interesting story about changes in environmental conditions. Since climate change is a long-term process, long-term datasets are necessary to separate annual variation in temperature, precipitation, etc from climate-related trends. Multiple decades worth of data are necessary, centuries worth of data would be ideal.
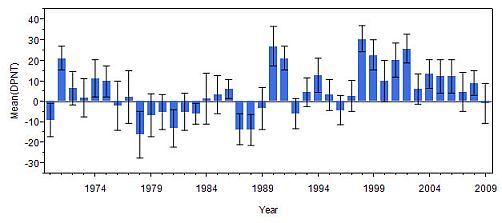
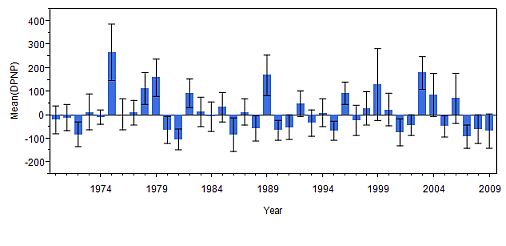
Examining the mean (average) departures from normal precipitation and temperature are one way to look for trends. The graphs below depict how the air temperature or precipitation in a given year differs from the norm, in Williamsburg VA. Positive values indicate extra rainfall or higher temperatures, while negative values indicate the opposite. No obvious trend is apparent in the graphs below. Possibly there is no trend, or there may be a trend which is not apparent because the time frame is too short, or trends have been hidden by climatic events, such as El Nino or La Nina years.
Mean Annual Departures from Normal Temperature
Mean Annual Departures from Normal Precipitation
Water temperature is another environmental factor expected to be impacted by climate change. The example below shows benthic (bottom) water temperature at a station on the James River. Early summer (June) benthic water temperature at this station appears to be showing an upward trend over time. This trend is not evident in the later summer months, suggesting that maximum water temperature is not increasing; however the river may be warming up earlier in the season. This can contribute to shifts in the timing of temperature-related events, such as spawning and phytoplankton blooms.
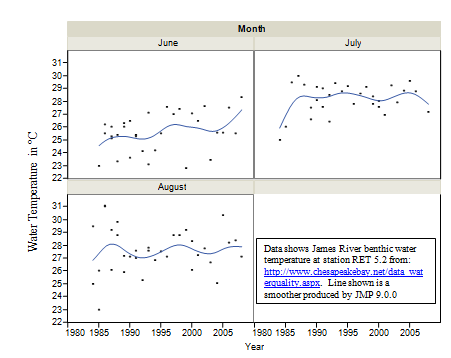
M. arenaria are temperature sensitive and the southern limit of their range is controlled by the upper water temperatures. Temperature influences growth and reproduction. In the Chesapeake Bay, M. arenaria does not usually survive temperatures above 28 degrees C. High temperatures during the fall spawning season may be particularly harmful to the population. Ideal spawning temperatures range from around 10-14 degrees C in the spring (May-mid June) and 12-15 degrees C in the fall (late August-December). Data for populations are from Chesapeake Bay Baywide Benthic Datasets; data for water temperature are from Chesapeake Bay Institute Water Quality (1985-1982) and Chesapeake Bay Program Water Quality (1984-present).
The example above shows the importance of data selection for determining climate-related changes. Since the trend does not show an increase in the maximum summer water temperature, no trend would be seen at all if the three summer months had been analyzed together. Similarly, different areas of the Chesapeake Bay have different processes at work. Stations near the mouth of the Bay, where cold ocean water enters, may not show such an obvious trend. Shallow water areas are more likely to reflect a change in air temperature with a concurrent change in water temperature.
Environmental factors expected to reflect shifts in climate include:
- CO2 Concentrations
- Air Temperature maximum and minimum temperatures and annual temperature distributions
- Water Temperature maximum and minimum temperatures and annual temperature distributions
- Freshwater Flows volume and timing of high flow events
- Sea Level
- Salinity distributions